
Tariffs Starting to Hit the Food Fan
- Eric Karlson
- Sep 29, 2025
- 3 min read

Updated: Oct 1, 2025
This is the food inflation outlook for August 2025. The Bureau of Labor Statistics released the August food inflation data on September 11th. We have been waiting for the tariff shoe to drop and it appears to be in motion. I have been taking a wait and see approach because we have not been in this position in the past, but in the last two months we are starting to see the data move.
Let's start with the food supply chain inputs - Oil Prices, PPI Farm Products, PPI food Manufacture, and PPI Grocery. The first element in food supply chain is oil and unlike all of other elements, it has been down significantly for some time and is expected to stay soft for the near future. Declining oil prices has been the pressure relief valve for food prices and would be higher if oil prices were not down so much.

The second element is PPI Farm Products, which jumped signficantly in July and continued to move up in August. PPI Farm Product price growth has doubled from 5% YOY to 10% YOY in these last two months.

With farm prices up, it is no surprise that food manufacturing prices were up signficantly this month. After moving horizontally since March 2025, the PPI jumped from a 4% increase YOY to 5%, which is the largest YOY gain since February 2023, which is when we were coming down from the Covid inflation. And we can expect the PPI Food Manufacturing to go higher if the PPI Farm Products remains high.

The final piece of the food inflation puzzle is PPI Grocery, which is essentially what Grocery Retailer's add onto food manufacturing prices and gets us to the final price. In the chart below, we can see a significant increase in the last two months. I would also expect it to fall if the PPI Food Manufacturing remains high as grocery retailers fight to keep customers in such a price sensitive market.

This takes us to CPI FAH. It had been increasing until March 2025 and then started to level out because Farm and Food Manfacturing prices were down or flat. But that appears to have shifted in August, which saw the CPI FAH number jump 2.7% YOY. CPI FAH was up 2.2% YTD, and 1.9% over the last 12 months, so a 2.7% increase is deviating from the recent trends.

Our rolling forecast is below. The forecasts were coming down as farm and food manufacture prices were flat or falling, but the bump Farm prices last month caused the August line (yellow) to increase, and the bump in both Farm and Food Manufacture caused the September line (grey) to significantly change trajectory.

The forecast distribution, which was 2.3% to 3.0% last month, has increased to 2.9% to 3.6% which is a major shift up.
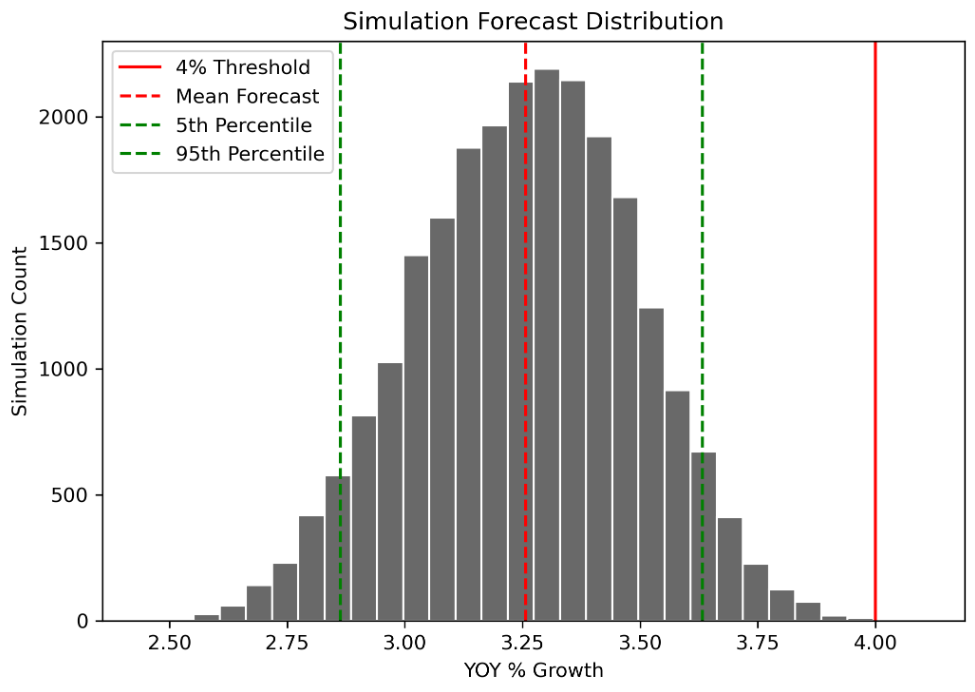
Is this due to tariffs? We cannot say with 100% confidence, but tariffs are likely playing a role. Will rates go higher? Yes and the concerning piece is much of the recent increases in Farm Products and Food Manufacturing have not been fully realized because they are lagged variables. In other words, the recent increases will have more impact in later months. Since the current model is leveling out at 3.4%, this would suggest that we could easily move beyond that when the Food Manufacturing spike hits over the next few months.
This brings us to when does food inflation start to disrupt the grocery industry? Historically, as I have mentioned in previous posts, is about 4% growth. It is at that growth rate that units start to soften, and the numbers are increasingly looking like we will approach and could even surpass that number. Food is largely inelastic at the macro level and it takes much higher prices to impact units, so it is meaningful when consumers start cutting back on grocery purchases. And if consumers start cutting back on grocery purchases, they will be an angry lot, particularly coming off the still fresh Covid memories. Stay tuned, this will be very interesting to see how this all unfolds in the data, particularly ahead of the mid year elections.

Comments