
Grocery Sales Without Oil Shock

This morning I ran the model with and without an oil shock to see how the market would change in the next six months. In the visual below, we have the oil shock numbers on the left and no oil shock on the right. There are two numbers in each box. The one on the left is the year-over-year increase in the previous 12 months and the number on the right is the 6-month forecast. For example, PPI Farm Products forecast is 6.9% with the oil shock and 0.1% with no oil shock.
The oil shock assumes an average oil price for 2026 at $87/barrel and the no oil shock assumes $60/barrel. The $87 assumption aligns with Goldman Sachs' estimate that oil prices will be about $83/barrel by Q4. My data assumes $100/barrel oil through June and then declines linearly to $83/barrel by Q4.
The results show very large impacts for PPI Farm Products and PPI Food Manufacturing. As mentioned above, the farm price forecast drops from 6.9% to 0.1%, which then helps food manufacturing prices drop from 3.6% to 1.3%. These two elements of the supply chain — particularly farmers — are very exposed to oil price fluctuations.
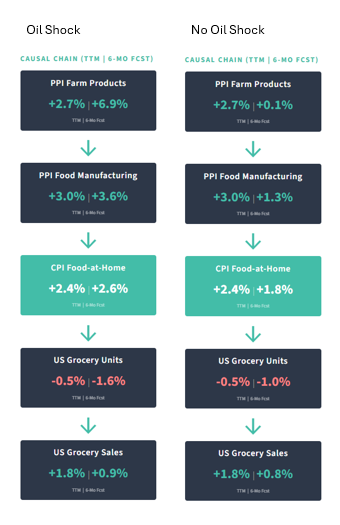
Food inflation would drop from about 2.6% to 1.8%. Some might think this is not very much versus the farm and food manufacturing numbers, but there are other variables at work — retail wages and retailer gross margins. Retail wages, which have been rising rapidly, are now leveling out. Retailers are also likely to compress margins to minimize customer loss. Both of these drivers are why the forecast with the oil shock is not higher than 2.6%. I suspect the 2.6% food inflation forecast is soft. The forecast distribution is 2.2% to 3.4%, and I would not be surprised if the actual number came in near the upper bound.

So how are units and sales impacted? The units forecast improves from -1.6% with the oil shock to -1.0% with no oil shock. This might surprise some, but grocery units have been declining for about a year. The market has been softening. Units have been negative YOY for most of the last eight months.
How many more units would be sold with no oil shock? Units would be down about 1.0% vs. 1.6% YOY. In a trillion-dollar market, assuming an average price of $3.90 per item, the 60 basis point improvement translates into about 700 million units over six months. Shoppers buy more, retailers sell more, and food manufacturers make more. This is unit-driven growth, not just inflation.
So what about grocery sales? Sales stay about the same — which may again surprise some — but this is due to the tradeoff between price and units. A 1% increase in price results in a 0.9% decrease in units on average. The higher prices from the oil shock suppress units by about the same amount, so sales numbers barely move.
Overall, the oil shock is impacting the market. It is hitting farmers and food manufacturers the hardest but moderates as it moves down the supply chain. Food inflation up 30+ percent since 2019 is not a footnote — it is the lived reality for middle and lower income households. Price sensitivity is up, and shoppers will actively seek out lower prices. Units and real growth would be higher without the oil shock. About 700 million more items would be sold and consumed, and overall sales remain about the same as price increases offset the unit declines.
This is an applied machine learning model. It is not perfect and is likely underforecasting food inflation over the next six months, but it gives us a sense of where we would be without the oil shock. Most, including myself, are somewhat surprised that higher oil prices are not impacting food inflation more. But as the model shows, there are other factors at work — global commodity prices, wages, and retailer markup — all of which are countering the upward push from oil.
The next six months will be a real test.


Comments